DbD Pip Tracker
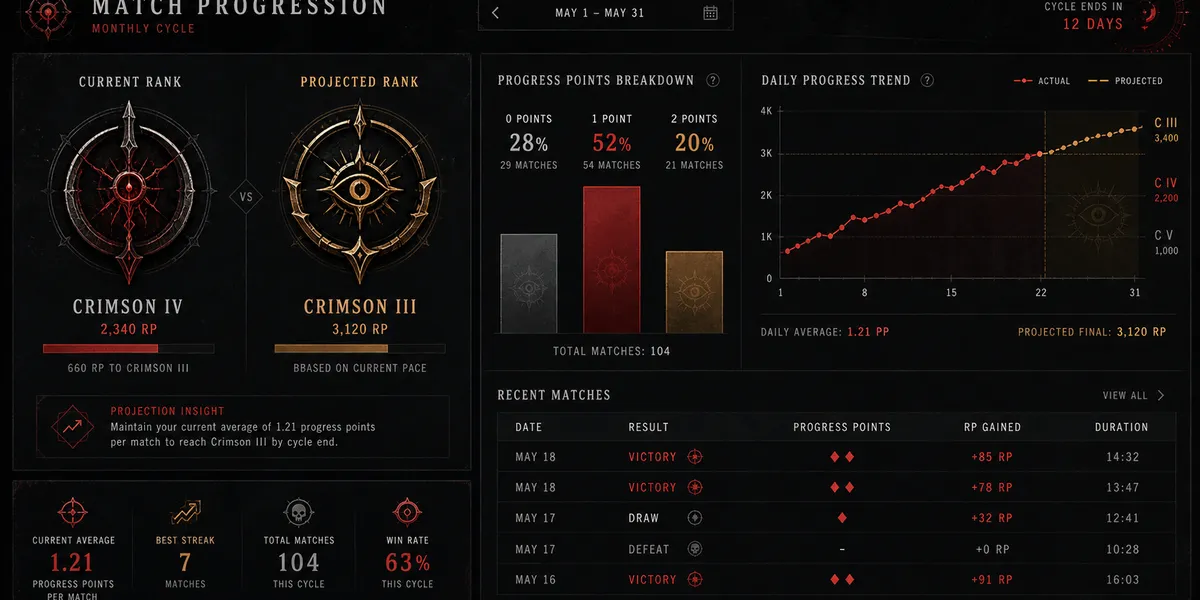
A live match-progress dashboard with monthly rank tracking, daily analytics, historical views, and end-of-cycle forecasts.
About the Project
DbD Pip Tracker is a personal analytics dashboard for tracking ranked progress in Dead by Daylight. After each match, it records a result of zero, one, or two pips and turns those individual events into a view of the complete monthly rank cycle.
The dashboard combines the current rank, projected end-of-cycle rank, pip distribution, daily performance, and historical months in one browser interface. Live updates allow the statistics page to react immediately when a new result is recorded.
What I Built
- An API for recording validated 0, 1, or 2-pip match results
- Separate JSON datasets for every monthly rank cycle
- Rank calculation across 20 progression thresholds
- Current and projected rank visualization
- End-of-cycle forecasting from the current daily average
- Daily grouping for games, pips, averages, and closing rank
- Historical month selection without mixing live and archived data
- Bar and line charts rendered with Chart.js
- WebSocket broadcasts after new match results
Technical Structure
The Express server stores each match as a small event containing its pip value and ISO timestamp. Statistics are derived from those events rather than maintained as separate counters.
data.push({
  value,
  timestamp: new Date().toISOString(),
});

saveData(data, monthYear);
Aggregation functions calculate totals, average pips per game, the distribution of result values, daily summaries, and rank thresholds. The browser requests the selected month through REST endpoints and listens for WebSocket updates only while the live month is active.
Design Decision
The tracker uses the 13th of each month as the boundary of a rank cycle instead of using calendar months. getCurrentMonthYear assigns matches before the 13th to the previous cycle, keeping saved data aligned with the game rather than the calendar.
Persisting raw match events makes it possible to recalculate every chart and forecast later. The tradeoff is synchronous file access and repeated aggregation on each request. A larger service would move storage behind an asynchronous repository or database and cache derived statistics.
What I Learned
This project moved beyond displaying a running total. It required defining a domain-specific time window, reconstructing rank from cumulative events, separating live and historical views, and presenting forecasts without changing archived results. The strongest lesson was that analytics are only trustworthy when their time boundaries and source events are modeled explicitly.
Development Notes
The devlog explores cycle-aware storage, aggregation, and rank forecasting in more detail: