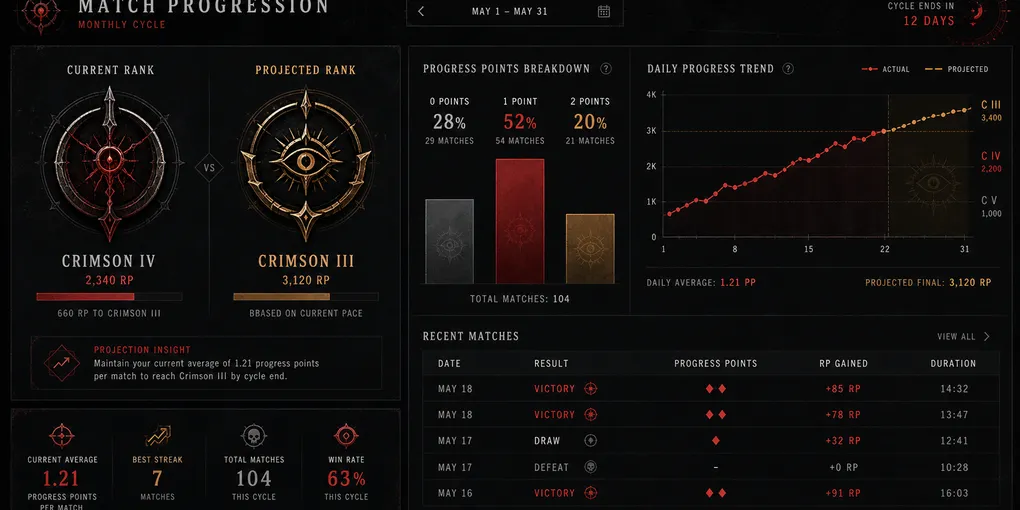
Tracking a match result is easy: store zero, one, or two pips. Turning months of those events into a useful rank dashboard is harder. The data needs the correct cycle boundary, historical periods must remain stable, and a forecast must distinguish observed progress from an estimate.
The Goal
I wanted one page that answered practical questions after every session: How many matches have I played? What is my average result? How is progress distributed across zero, one, and two-pip games? Which rank should I reach if the current pace continues?
The dashboard also needed to retain previous cycles. Selecting an archived month should show its final result without receiving updates from the currently active tracker.
The Core Approach
Every match is stored as an event with a value and timestamp. The server derives all statistics from that event list:
const totalGames = data.length;
const totalPips = data.reduce((sum, entry) => sum + entry.value, 0);
const averagePips = totalGames
  ? (totalPips / totalGames).toFixed(2)
  : "0.00";
Keeping the raw events makes the model flexible. Totals, distributions, daily summaries, and ranks can all be recalculated without migrating previously saved files.
The Main Challenge
The game cycle does not follow a normal calendar month. It resets on the 13th, so results recorded early in a calendar month still belong to the previous rank period.
getCurrentMonthYear applies that rule before selecting a JSON file. The same boundary drives the forecast window: it calculates days played since the last reset and days remaining until the next one.
Historical forecasts require another distinction. For the live cycle, the tracker projects additional progress from the current daily average. For an archived cycle, it uses the recorded total so past results do not continue changing with the current date.
What Worked
The forecast uses a deliberately simple model:
- Sum all recorded pips in the selected cycle.
- Divide the total by elapsed cycle days.
- Multiply that daily average by the remaining days.
- Map the projected total to the same rank thresholds as the current result.
Daily aggregation groups timestamps by their ISO date and records games, pips, average result, and cumulative closing rank. Chart.js then renders the 0/1/2 distribution as a bar chart and daily totals and averages as a line chart.
The month selector controls the real-time connection. When the live month is selected, the page connects to the WebSocket server. When an archived month is selected, it closes that connection and treats the requested dataset as a static historical view.
What I Would Improve Next
The forecast currently assumes that progress continues at a constant daily rate. A stronger model could use only active play days, include a confidence range, or compare the current cycle with earlier ones.
On the engineering side, I would centralize duplicated daily aggregation logic, use asynchronous persistence, negotiate ws versus wss from the page protocol, and add schema validation for stored events. Automated boundary tests around the 13th and year rollover would protect the most important domain rule.
The project showed that a small event model can support a much richer dashboard when aggregation, time windows, and live delivery are kept as separate concerns.
The Project
The project page contains the feature overview, technical structure, and design tradeoffs: